Analysis of 3k T cells from cancer#
This is a copy of the part of the scirpy tutorial where iggytop is being integrated. For the full tutorial refer to the scirpy documentation or its source Here, the script serves to test if the tutorial notebook runs as expected using the latest iggytop release.
import muon as mu
import scanpy as sc
import scirpy as ir

# temporary fix for deprecated matplotlib functionality
import IPython.display
from matplotlib_inline.backend_inline import set_matplotlib_formats

IPython.display.set_matplotlib_formats = set_matplotlib_formats

sc.set_figure_params(figsize=(4, 4))
sc.settings.verbosity = 2  # verbosity: errors (0), warnings (1), info (2), hints (3)
/home/docs/checkouts/readthedocs.org/user_builds/iggytop/envs/latest/lib/python3.13/site-packages/muon/_core/preproc.py:31: FutureWarning: `__version__` is deprecated, use `importlib.metadata.version('scanpy')` instead
  if Version(scanpy.__version__) < Version("1.10"):
sc.logging.print_header()
In this tutorial, we re-analyze single-cell TCR/RNA-seq data from Wu et al. []. generated on the 10x Genomics platform. The original dataset consists of >140k T cells from 14 treatment-naive patients across four different types of cancer. For this tutorial, to speed up computations, we use a downsampled version of 3k cells.
Importing data#
Scirpy natively supports reading IR data from Cellranger (10x),
TraCeR (Smart-seq2)
or the AIRR rearrangement schema and provides helper functions to import other data types. We provide a dedicated tutorial on data loading with more details.
Warning
scirpy’s data structure has been updated in v0.13.0.
Previously, receptor data was expanded into columns of adata.obs, now they are stored as an awkward array in adata.obsm["airr"].
Moreover, we now use MuData to handle paired transcriptomics and AIRR data.
AnnData objects created with older versions of scirpy can be upgraded with scirpy.io.upgrade_schema() to be compatible with the latest version of scirpy.
Please check out
The release notes for details about the changes
The documentation about Scirpy’s data structure and
Scirpy’s receptor model.
The example dataset for this tutorial ships with the scirpy package. We can conveniently load it from the datasets module:
mdata = ir.datasets.wu2020_3k()
/home/docs/checkouts/readthedocs.org/user_builds/iggytop/envs/latest/lib/python3.13/site-packages/anndata/utils.py:362: ExperimentalFeatureWarning: Support for Awkward Arrays is currently experimental. Behavior may change in the future. Please report any issues you may encounter!
  warnings.warn(msg, category, stacklevel=stacklevel)
/home/docs/checkouts/readthedocs.org/user_builds/iggytop/envs/latest/lib/python3.13/site-packages/mudata/_core/mudata.py:1598: FutureWarning: From 0.4 .update() will not pull obs/var columns from individual modalities by default anymore. Set mudata.set_options(pull_on_update=False) to adopt the new behaviour, which will become the default. Use new pull_obs/pull_var and push_obs/push_var methods for more flexibility.
  self._update_attr("var", axis=0, join_common=join_common)
/home/docs/checkouts/readthedocs.org/user_builds/iggytop/envs/latest/lib/python3.13/site-packages/mudata/_core/mudata.py:1461: FutureWarning: From 0.4 .update() will not pull obs/var columns from individual modalities by default anymore. Set mudata.set_options(pull_on_update=False) to adopt the new behaviour, which will become the default. Use new pull_obs/pull_var and push_obs/push_var methods for more flexibility.
  self._update_attr("obs", axis=1, join_common=join_common)
mdata is a MuData object with two modalities: gex for gene expression and airr for immune-receptor data.
mdata
MuData object with n_obs × n_vars = 3000 × 30727
  2 modalities
    gex:	3000 x 30727
      obs:	'cluster_orig', 'patient', 'sample', 'source'
      uns:	'cluster_orig_colors'
      obsm:	'X_umap_orig'
    airr:	3000 x 0
      obs:	'high_confidence', 'is_cell', 'clonotype_orig'
      obsm:	'airr'
Preprocessing Transcriptomics data#
Gene expression (GEX) data needs to be filtered and preprocessed as with any other single-cell dataset. For this tutorial, we perform minimal preprocessing for demonstration purposes. For a real dataset, we recommend following the scverse tutorials and the single-cell best practice book.
sc.pp.filter_genes(mdata["gex"], min_cells=10)
sc.pp.filter_cells(mdata["gex"], min_genes=100)
filtered out 18877 genes that are detected in less than 10 cells
sc.pp.normalize_per_cell(mdata["gex"])
sc.pp.log1p(mdata["gex"])
sc.pp.highly_variable_genes(mdata["gex"], flavor="cell_ranger", n_top_genes=5000)
sc.tl.pca(mdata["gex"])
sc.pp.neighbors(mdata["gex"])
normalizing by total count per cell
    finished (0:00:00): normalized adata.X and added
    'n_counts', counts per cell before normalization (adata.obs)
extracting highly variable genes
/tmp/ipykernel_1518/3237590329.py:1: FutureWarning: Use sc.pp.normalize_total instead
  sc.pp.normalize_per_cell(mdata["gex"])
/home/docs/checkouts/readthedocs.org/user_builds/iggytop/envs/latest/lib/python3.13/site-packages/scanpy/preprocessing/_simple.py:590: FutureWarning: Use sc.pp.normalize_total instead
  normalize_per_cell(
finished (0:00:02)
computing PCA
with n_comps=50
finished (0:00:00)
computing neighbors
using 'X_pca' with n_pcs = 50
finished (0:00:02)
For the Wu2020 dataset, the authors already provide clusters and UMAP coordinates. Instead of performing clustering and cluster annotation ourselves, we will just use the provided data. The clustering and annotation methodology is described in their paper.
mdata["gex"].obsm["X_umap"] = mdata["gex"].obsm["X_umap_orig"]
mapping = {
    "nan": "other",
    "3.1-MT": "other",
    "4.1-Trm": "CD4_Trm",
    "4.2-RPL32": "CD4_RPL32",
    "4.3-TCF7": "CD4_TCF7",
    "4.4-FOS": "CD4_FOSS",
    "4.5-IL6ST": "CD4_IL6ST",
    "4.6a-Treg": "CD4_Treg",
    "4.6b-Treg": "CD4_Treg",
    "8.1-Teff": "CD8_Teff",
    "8.2-Tem": "CD8_Tem",
    "8.3a-Trm": "CD8_Trm",
    "8.3b-Trm": "CD8_Trm",
    "8.3c-Trm": "CD8_Trm",
    "8.4-Chrom": "other",
    "8.5-Mitosis": "other",
    "8.6-KLRB1": "other",
}
mdata["gex"].obs["cluster"] = mdata["gex"].obs["cluster_orig"].map(mapping)
Now that we filtered obs and var of the GEX modality, we need to propagate those changes back to the MuData object.
mdata.update()
/home/docs/checkouts/readthedocs.org/user_builds/iggytop/envs/latest/lib/python3.13/site-packages/mudata/_core/mudata.py:1598: FutureWarning: From 0.4 .update() will not pull obs/var columns from individual modalities by default anymore. Set mudata.set_options(pull_on_update=False) to adopt the new behaviour, which will become the default. Use new pull_obs/pull_var and push_obs/push_var methods for more flexibility.
  self._update_attr("var", axis=0, join_common=join_common)
/home/docs/checkouts/readthedocs.org/user_builds/iggytop/envs/latest/lib/python3.13/site-packages/mudata/_core/mudata.py:1461: FutureWarning: From 0.4 .update() will not pull obs/var columns from individual modalities by default anymore. Set mudata.set_options(pull_on_update=False) to adopt the new behaviour, which will become the default. Use new pull_obs/pull_var and push_obs/push_var methods for more flexibility.
  self._update_attr("obs", axis=1, join_common=join_common)
Query epitope databases#
We can use scirpy to query reference databases or datasets to annotate IRs with certain
features, such as epitope specificity. The reference database can be any dataset in scirpy’s AnnData format and you can follow the instructions in the data loading tutorial
to build a custom reference database, if it is not available from scirpy.datasets yet.
Querying reference datasets uses the same logic as defining clonotypes:
scirpy function |
objective |
|---|---|
|
Compute sequence-based distance matrices . |
|
For each cell, identify matching entries in a reference database. |
|
Transfer annotations from reference database to |
|
Return a dataframe with all matching annotations. |
Here, we obtain IggyTop, a metadatabase of multiple receptor databases
including IEDB and VDJdb, and annotate epitopes based on amino acid sequence identity.
For demonstration purposes on this toy dataset we use rather lenient settings: For a match, we specify that it is enough that either of the VJ and VDJ sequences, and either of the primary or secondary receptor chains matches the database.
iggytop_tag = "data-2026.05.05.110331"
iggytop = ir.datasets.iggytop(tag=iggytop_tag)
ir.pp.ir_dist(mdata, iggytop, metric="identity", sequence="aa")
WARNING: No chain indices found under adata.obsm['chain_indices']. Running scirpy.pp.index_chains with default parameters.
Filtering chains...
Indexing VJ chains...
Indexing VDJ chains...
build result array
Computing sequence x sequence distance matrix for VJ sequences.
Computing sequence x sequence distance matrix for VDJ sequences.
ir.tl.ir_query(
    mdata,
    iggytop,
    metric="identity",
    sequence="aa",
    receptor_arms="any",
    dual_ir="any",
)
Initializing lookup tables.
Computing clonotype x clonotype distances.
Stored IR distance matrix in `adata.uns["ir_query_iggytop_deduplicated_aa_identity"]`.
ir_query_annotate_df() allows us to retrieve all pairs cells with their of matching entries. If a cell matches multiple entires from the reference database, the resulting data frame will contain multiple rows for the same cell.
ir.tl.ir_query_annotate_df(
    mdata,
    iggytop,
    metric="identity",
    sequence="aa",
    include_ref_cols=["antigen_species", "antigen_name"],
)
| antigen_species | antigen_name | |
|---|---|---|
| LN2_GCACTCTCAGGGATTG-2 | Severe acute respiratory syndrome coronavirus 2 | ORF7a protein |
| LN4_GAAACTCTCATCATTC-1 | Epstein-Barr virus | EBNA 3B |
| LN4_GAAACTCTCATCATTC-1 | Human immunodeficiency virus | Gag protein |
| LN4_GAAACTCTCATCATTC-1 | Cytomegalovirus | IE-1 |
| LN4_GAAACTCTCATCATTC-1 | Epstein-Barr virus | EBNA 3B |
| ... | ... | ... |
| RT3_GCAGTTAGTATGAAAC-1 | Homo sapiens herpesvirus 4 | BMLF1 protein |
| RT3_GCAGTTAGTATGAAAC-1 | Homo sapiens | POMT1 protein |
| RT3_GCAGTTAGTATGAAAC-1 | Mycobacterium tuberculosis | Uncharacterized protein MT1568 |
| RT3_GCAGTTAGTATGAAAC-1 | Severe acute respiratory syndrome coronavirus 2 | ORF9b protein |
| RT3_GCAGTTAGTATGAAAC-1 | Homo sapiens herpesvirus 4 | Replication and transcription activator |
4930 rows × 2 columns
Alternatively, to break down the annotation to a single-value per cell, you can use
ir_query_annotate(). Depending on the specified strategy it will only label unambiguous matches, or use the most frequent value.
ir.tl.ir_query_annotate(
    mdata,
    iggytop,
    metric="identity",
    sequence="aa",
    include_ref_cols=["antigen_species"],
    strategy="most-frequent",
)
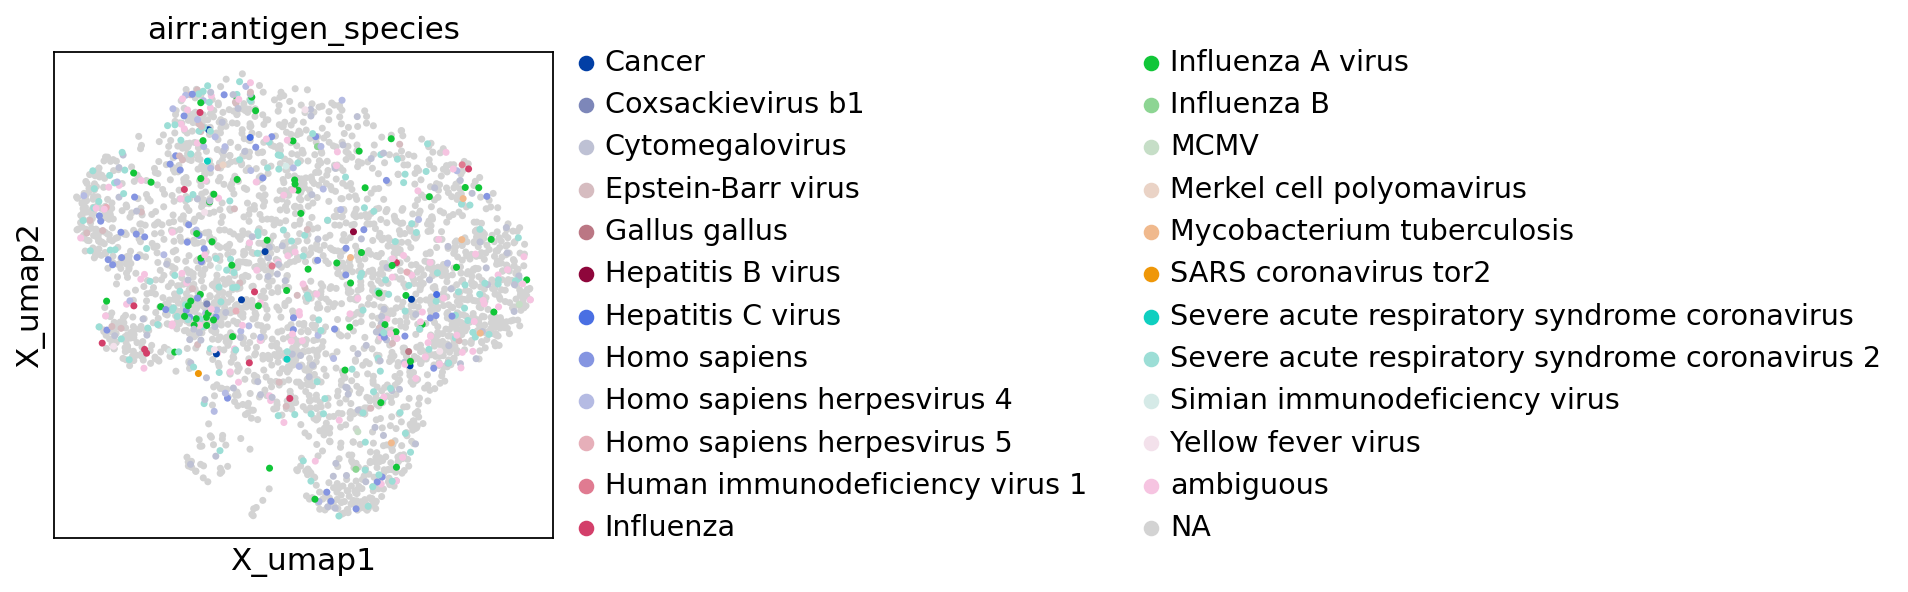
Stored result in `mdata.obs["airr:antigen_species"]`.
mu.pl.embedding(mdata, "gex:umap", color="airr:antigen_species")